Unpacking UPX
In this article I will cover how the UPX packer works and how to manually unpack it.
For the purpose of demonstration I will unpack a sample of the infamous conti ransomware, which we see a lot in the wild these days, and is using UPX packer.
What is UPX?
UPX (the Ultimate Packer for Executables) is an open-source packer, based on the UCL compression algorithm. It is a very common and well known packer, which is also considered to be an easy one to unpack.
Although UPX doesn’t use sophisticated techniques to secure its packed executables, like other known packers/protectors (such as Themida, VMProtect, Andromeda, Obsidium, and so on..), And even though there are plenty of automatic tools for unpacking it, I think that it’s a great practice to analyze it and learn how to unpack it manually.
Identifying UPX Packed Executable
The first thing we need to do before unpacking an executable is to determine if the file is packed. Additionally, we can continue and try to identify the packer, which in case of dealing with more advanced packers can help us a lot at the unpacking process.
So how do we do it?
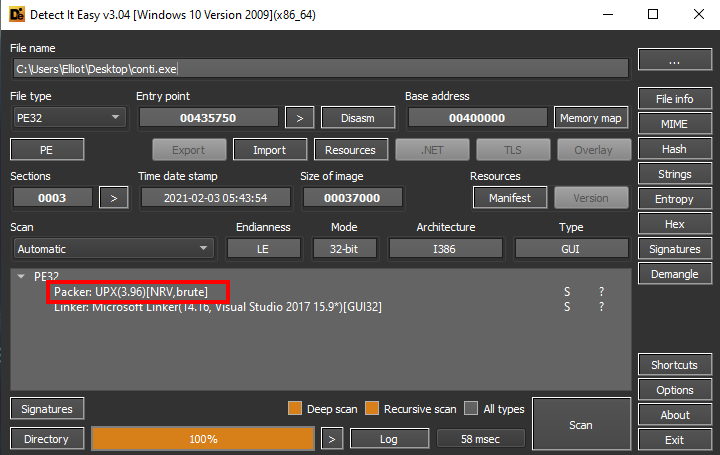
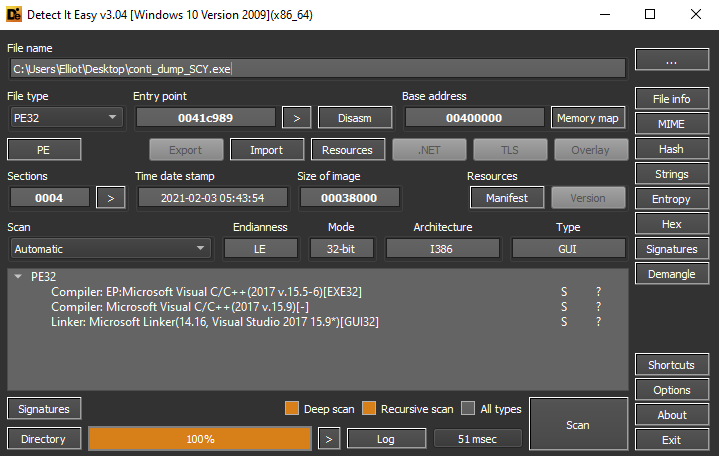
UPX is common enough that most PE analyzing tools, such as PEid or DIE (detect it easy), will detect it.
Example from using DIE:
But lets assume that we can’t use those tools or that they don’t detect our packer.
What else can we do?
We can look for one of the following indicators.
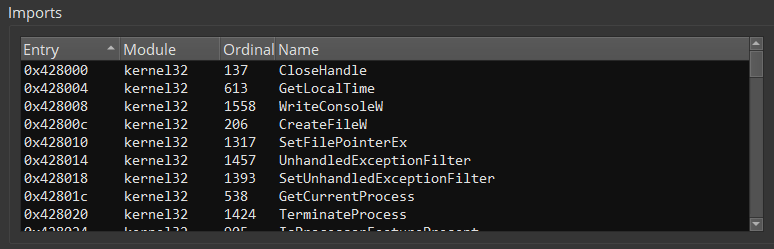
Looking at the import table - Small import table can be a good indicator for a packed executable. Packers most likely will pack the program with its import table, which means that the import table that we see is probably the packers import table and it tends to be smaller than average.
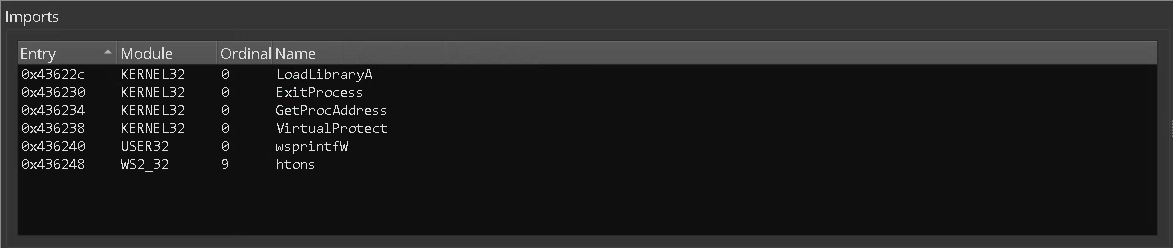
In the picture above we see the import table of our sample. Just a few imports..
Looking at the sections - Another common indicator is the names of the executable sections. Most common executables will probably have the following known sections created by the compiler: .text, .data, .rdata.. but when looking at a packed file we might see other sections and even less in number.
Our sample sections:
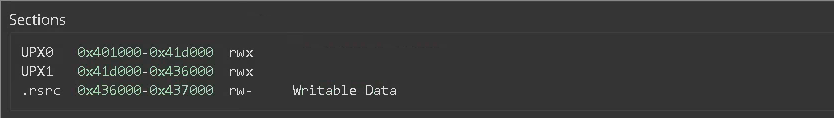
You can see that our sample does not have any of the known sections, instead it has UPX0, UPX1 and .rsrc .
In our case we can also infer from the sections names that we are looking at a UPX packed executable.
Checking the entropy - Encrypted/packed data tends to have a higher entropy than a binary code. Therefore we can check the sections entropy to identify encrypted or packed sections.
Most disassemblers and PE analyzing tools have this feature.
Unpacking
So by now we know that we are dealing with a packed file. The next step is to debug it to a point that the unpacked data is loaded in memory, and to find the original entrypoint.
NOTE: This might not be an easy task when dealing with some other packers, but this is a good attempt to begin with.
Before We Start
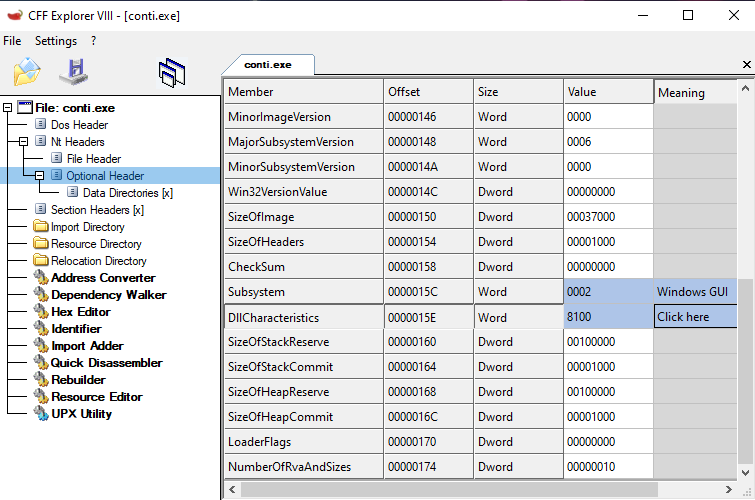
It is very important that before we start debugging, we make sure that the ASLR mechanism is disabled. Without ASLR disabled our dumping method will fail.
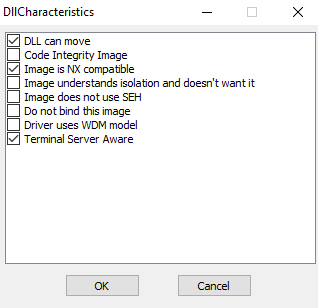
One way to do this is by using a PE editor (i.e CFF explorer), and modify the value of DllCharacteristics. We want to disable the bit of the flag DLL can move.
Debugging
Let’s open our sample with a debugger and stop at the entrypoint.
For this demonstration I will use x64dbg.
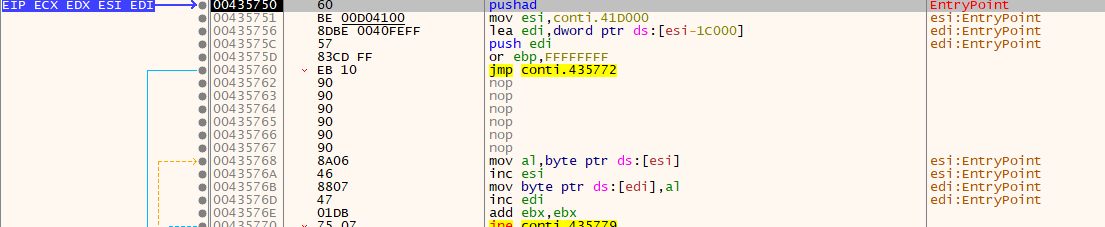
As you can see the first instruction is PUSHAD (Push All Double), which is pretty common when dealing with packers. The PUSHA instruction stores all general registers values on the stack. That’s how the packer will restore the registers state after unpacking.
Now, we can continue by looking after the POPAD instruction, which ideally should be near the jump to the unpacked code. But before doing so, lets take a deeper look at the packer code and try to understand it.
Looking at the memory map we can see that the entrypoint is located in the UPX1 section.

It seems that the decompression code stored in this section.
Lets take a look at UPX0:
![]() It’s empty!
It’s empty!
Ok, so this is probably where our unpacked code will be stored. To confirm this, we can set a memory/hardware breakpoint on this section and see.
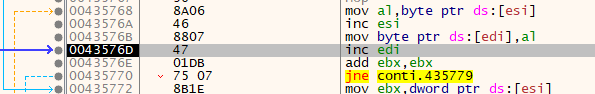
The breakpoint worked, and it looks like we stopped at some loop that writes code into the empty section.
Our assumption was correct!
We now have a better understanding of the purpose of those sections.
Now, all we have to do is to find our OEP (original entrypoint).
We can achieve this by setting a breakpoint on UPX0 that will stop at execution, looking for a jump near to a POPAD instruction and many other ways..
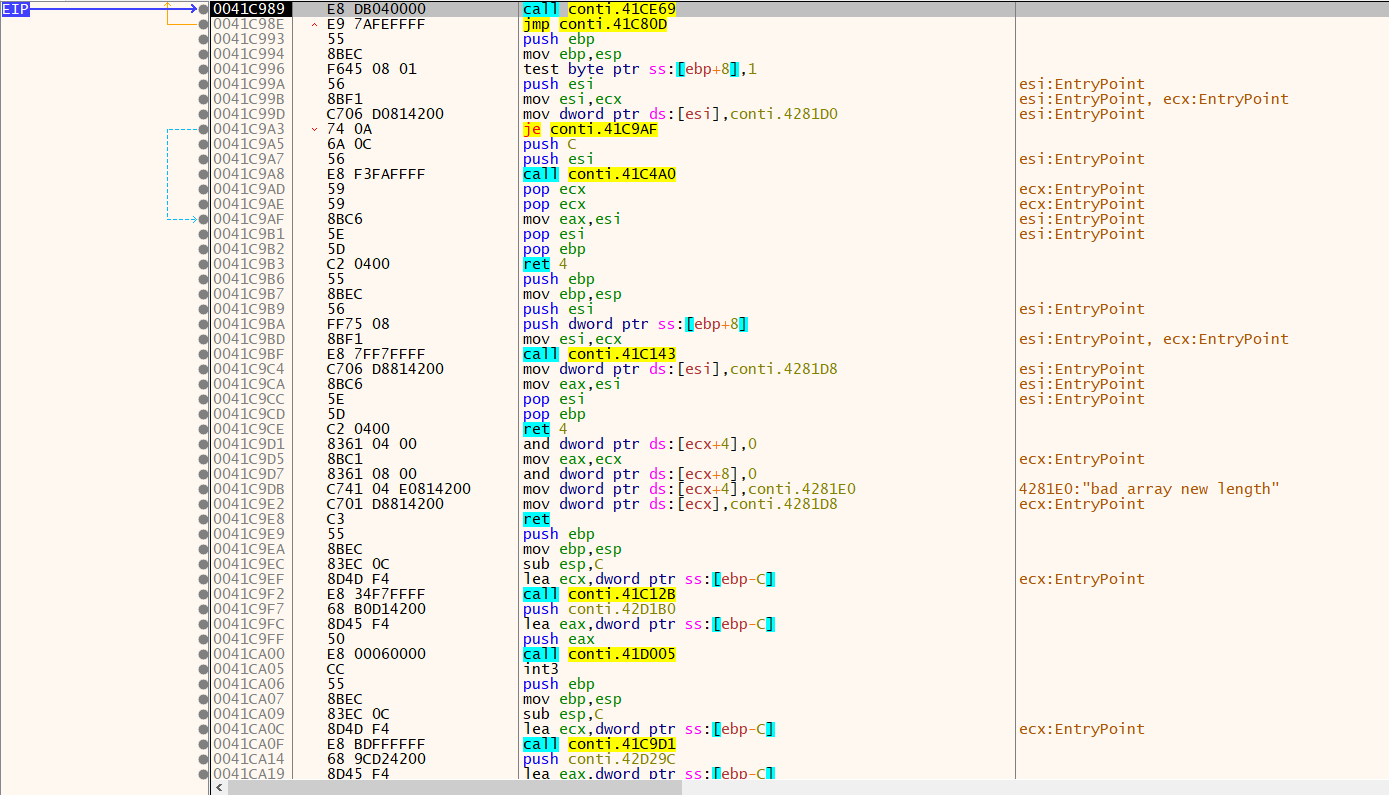
UPX1 is quite a small section so by looking at its CFG we can find immediately a POPAD instruction near a jump to an uninitialized area.
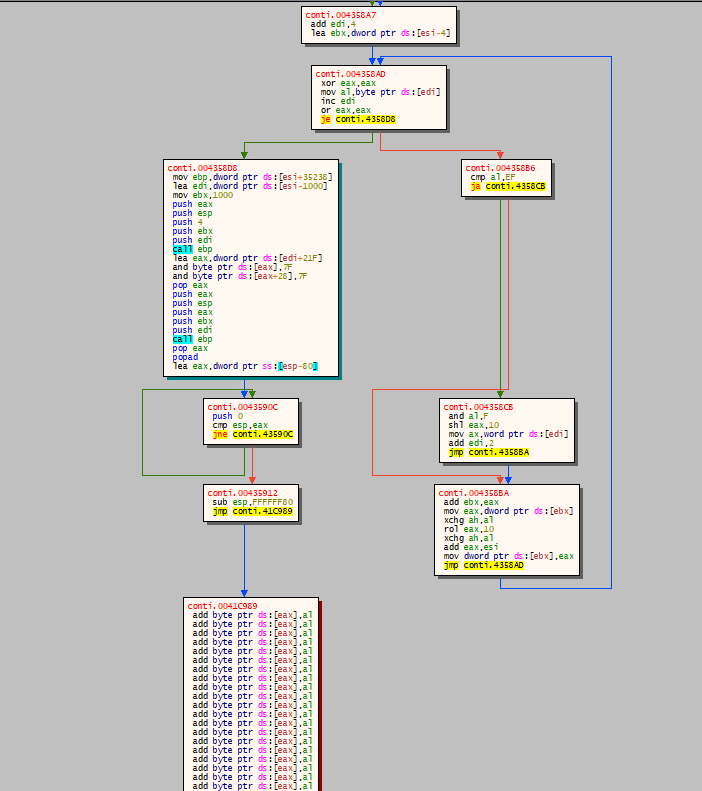
That’s it! That’s the jump to our OEP.
Now, let’s put a breakpoint at our OEP.
Dumping the memory
Now that the unpacked data is loaded into memory and that we located our OEP, we can create a memory dump and create a new, unpacked PE of it.
For this purpose we can use Scylla which is included in x64dbg.
Instructions:
Launch Scylla and set the OEP.
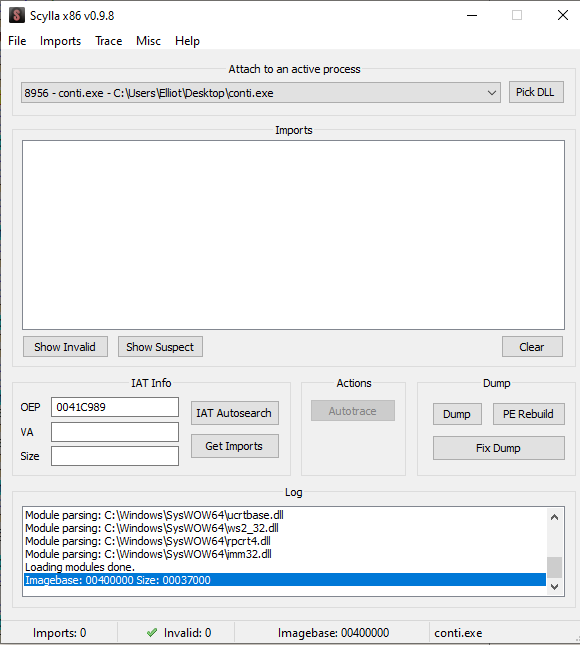
Next, press on IAT Autosearch and then on Get Imports.
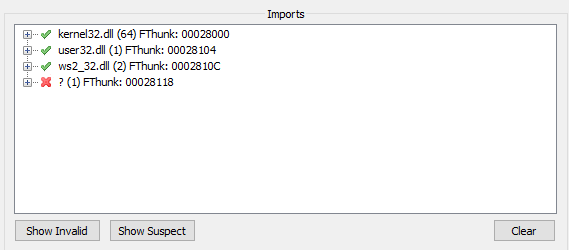
Now, you should see the imports for the dump. Make sure that they are all valid.
You might need to remove invalid imports as such:
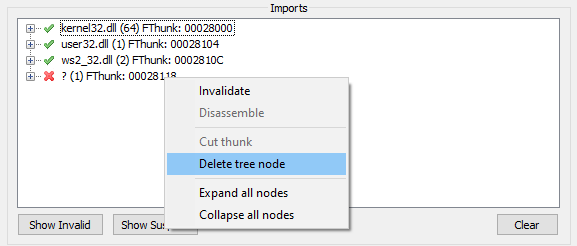
Lastly, create a dump by pressing the Dump button, and then press on Fix Dump and choose your dump file.
You should see something like this:
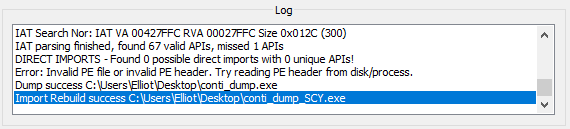
Done! We now have an unpacked version of our sample.
References:
-
UPX official website - https://upx.github.io/
-
UPX wiki page - https://en.wikipedia.org/wiki/UPX